Belgium
In Belgium the implementation of the CAP - as the agricultural and rural development in general - is a regional responsibility. The situation in Flanders and Wallonia differs also as to these general country figures. That's why these general figures for Flanders and Wallonia will be presented as soon as possible in the next update of the website.
• General country description
• A. First pillar: implementation of CAP reforms (2003)
• B. Second pillar: implementation of RDP measures during 2007-2013
• C. Vision for the CAP beyond 2013: a short overview of the debate (at Member State level) on future CAP reform
• D. Literature, sources, references
• The comparative analysis provides a compact overview of CAP implementation across all 27 Member States and their visions of the future of the CAP
General country discription
Belgium |
Comparison with EU-25 |
Population, 2005 (*1,000,000): 10.4 |
2.3% of population in EU-25 |
Population density, 2003 (inh./km2): 340 |
118 in EU-25 |
GDP/capita, 2005 (PPS): 27,600 |
118% of GDP/capita in EU-25 |
Share agriculture in total employment, 2002 (%): 2 |
5% in EU-25 |
Share Utilized Agricultural Area in total land area, 2003 (%): 46 |
46% in EU-25 in 1998 |
Average farm size, 2005 (ha): 28 |
19 in EU-15 |
Number of farms, 2005 (*1000): 49.5 |
0.8% of farms in EU-25 |
Source: own calculations based on Eurostat
Belgium |
Flanders |
Wallonia |
Population, 2005 (*1,000,000): 10.4 1 |
6.0 |
3.4 |
Population density, 2003 (inh./km2): 340 |
443 |
200 |
GDP/capita, 2005 (PPS): 27,600 |
26,483 (2004) |
19,340 (2004) |
Share agriculture in total employment, 2002 (%): 2 |
2 (2003) |
p.m. |
Share Utilized Agricultural Area in total land area, 2003 (%): 46 |
47 (2005) |
45 (2005) |
Average farm size, 2005 (ha): 28 |
18 |
44 |
Number of farms, 2005 (*1000): 49.5 |
34.4 |
17.1 |
1) Of which 1 million inhabitants in Brussels. Sources: Institut wallon de lévaluation, de la prospective et de la statistique (2006); Studiedienst van de Vlaamse regering (2006)
Distribution of farming types, 2005 (% of total): Belgium
Field crops |
Horti- |
Perma- |
Dairy |
Grazing livestock |
Grani- |
Mixed cropping |
Mixed livestock |
Mixed crops-
live- |
Other |
16 |
8 |
4 |
14 |
31 |
7 |
2 |
5 |
12 |
0 |
Source: own calculations based on Eurostat
Distribution of farming types, 2005 (% of total): Flanders
Field crops |
Horti- |
Perma- |
Dairy |
Grazing livestock |
Grani- |
Mixed cropping |
Mixed livestock |
Mixed crops- live- |
Other |
15 |
18 |
0 |
14 |
21 |
8 |
20 |
4 |
0 |
0 |
Source: Vlaamse Overheid (2006)
Distribution of farming types, 2005 (% of total): Wallonia
Field crops |
Horti- |
Perma- |
Dairy |
Grazing livestock |
Grani- |
Mixed cropping |
Mixed livestock |
Mixed crops- live- |
Other |
18 |
0 |
0 |
15 |
24 |
9 |
0 |
14 |
14 |
7 |
Source: Ministerie van het Waalse Gewest van België (2005)
EU funding for the Single Payment Scheme (SPS)
and the second pillar, 2007-2013
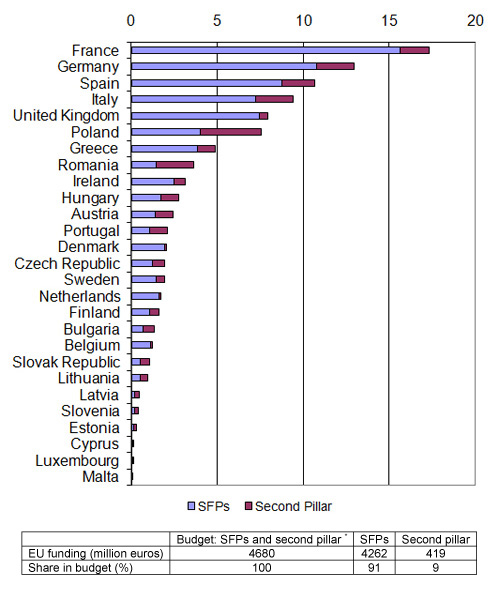
* Funding according to CAP budget including Bulgaria and Romania.
Sources: Agra Europe (2007); CEU (2006); EC (2007a)
A. First pillar: implementation CAP reform (2003)
A.1 Single Payment Scheme
Model
SPS historical (EC, 2007b)
Coupling measures
Complete decoupling,except for suckler cows, slaughter premium meat calves (100% coupled), seeds (some species) (100% coupled), dairy premium in 2006.
Reason for selection
No information.
A.2 EU budget for Single Payment Scheme (SPS) per year (National ceiling) 2005-2013
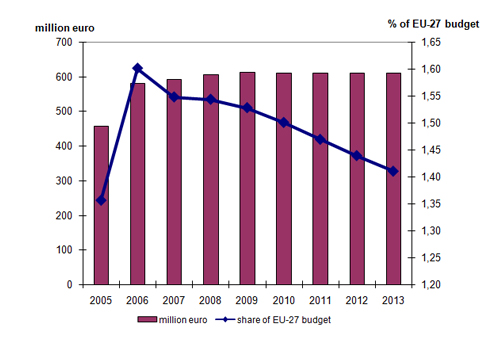
Source: 2005: EC (2006); 2006-2013: CEU (2006) and Agra Europe (2007)
Share of the farms that receive SPS of the total number of farms (2005) (% of total)
No information.
Tradability of SPS
No information.
A.3 Cross-compliance: Good Agricultural and Environmental Conditions (GAEC)
Source: IEEP, 2005
Selected standards of the GAEC (Flanders)
Issue |
Standards |
Summary of farmers obligations |
soil erosion |
minimum land management reflecting site-specific conditions |
1. Farmers must implement at least one appropriate measure from a list against erosion on parcels at high risk of erosion. Areas at high risk of erosion are fixed by
the competent administration.
|
soil organic matter |
arable stubble management |
no burning |
|
EXTRA: measure soil organic matter and pH |
annual measurement and depending on results corrective measures |
protection of permanent pastures |
|
Each farmer must maintain their individually assigned area of permanent pasture; no decrease accepted, probably related to manure surplusses |
minimum level of maintenance |
avoiding the encroachment of unwanted vegetation on agricultural land |
Unwanted vegetation and undergrowth must be controlled especially thistle.
Woody growth of more than 1.5 m must be managed by mowing or other appropriate measures.
Uncultivated fields must be sown no later than 31 May.
On plots used for non-agricultural purposes, soil cover must be managed in such a way to avoid the spread of weeds.
|
Selected standards of the GAEC (Wallonia)
Issue |
Standards |
Summary of farmers' obligations |
soil erosion |
minimum land management reflecting site-specific conditions |
Rules apply for arable parcels considered at risk of soil erosion. Restrictions for ploughing and root crops. Rules apply for grassed strips. No grazing or mowing after 1 July. |
soil organic matter |
arable stubble management |
no burning |
soil structure |
Irrigated soil deficiencies must be corrected according to the last soil analysis results |
annual measurement and depending on results corrective measures |
protection of permanent pastures |
|
Each farmer must maintain their individually assigned area of permanent pasture; no decrease accepted, probably related to manure surpluses |
minimum level of maintenance |
avoiding the encroachment of unwanted vegetation on agricultural land |
Unwanted vegetation and undergrowth must be controlled especially thistle. Woody growth of more than 1.5 m must be managed by mowing or other appropriate measures. Uncultivated fields must be sown no later than 31 May. On plots used for non-agricultural purposes, soil cover must be managed in such a way to avoid the spread of weeds. No profit making activities unconnected with agriculture on agricultural land. |
Belgium pays attention to all issues but soil structure; protection of permanent pasture is dictated by the excessive manure production.
Reason for selection of cross compliance standards
No information.
A.4 Further reform of market regulations
No information.
B. Second pillar: implementation of RDP measures 2007-2013
B.1 Programme level and approval
There is one national strategy and there are two regional RDPs (for Flanders and Wallonia). The Rural Development Committee (consisting of representatives of the 27 Member States) has approved the RDP for Flanders on 25 October 2007 and the RDP for Wallonia on 21 November 2007.
B.2 Distribution of public budget over the axes (%) 1)
|
axis 1: competitiveness |
axis 2: environment and land management |
axis 3: rural economy |
Axis 4: Leader |
Flanders |
68 |
17 |
9 |
6 |
Wallonia |
48 |
40 |
8 |
4 |
Figures excluding Technical Assistance
Source: own calculations based on Departement Landbouw en Visserij (2006); Gouvernement Wallon (2007)
B.3 Integration of Leader in axis 1, 2 and 3
In Flanders, Leader will only contribute to initiatives and measures of Axis 3. In Wallonia, Leader contributes to Axes 1 and 2 and especially to axis 3. In both regions, Leader should contribute to the improvement of new approaches to governance and to the mobilization of the endogenous development of local sources and actors.
B.4 Local Action Groups (LAGs)
In Flanders there is, at this moment, no exact information on the number of LAGs for the period 2007-2013. Each Flemish Provincial Management Committee can decide how many LAGs each Flemish Province can have. The total number of LAGs in Flanders is limited to 10 (Departement Landbouw en Visserij, 2007: 386). However the 5 existing Flemish LAGs will probably stay operational during the next period. In Wallonia, it is intended to create 15 LAGs, of which 60% should have been selected in the first programming period (2000-2006). In the previous period (2000-2006) there were 5 LAGs in Flanders and 15 LAGs in Wallonia.
B.5 RDP budget
RDP budget 2007-2013 (million euros)
|
total public budget |
% co-financing EAFRD1) |
EAFRD budget |
Contribution private sector |
Total costs |
National top-ups |
Flanders |
667.6 |
34 |
224.5 |
1477.6 |
2145.2 |
40.9 |
Wallonia |
477.0 |
41 |
194.1 |
898.4 |
1375.4 |
0 |
Belgium total |
1144.6 |
|
418.6 |
2376.0 |
3520.6 |
|
1) % of co-financing may vary per axis.
Source: Departement Landbouw en Visserij (2007); Gouvernement Wallon (2007).
B.6 Less Favoured Areas
Flanders has designed 8,610 ha as Less Favoured Areas (LFA) eligible for payments (areas with environmental restrictions) (Departement Landbouw en Visserij, 2007: 171, 174). Wallonia has designed 232,660 ha as area with handicaps other than mountain areas and 22,000 ha as area with environmental restrictions (Gouvernement Wallon, 2007: 196, 203). This means a decrease compared to 2005, when 283,000 ha (21% of UAA) was designed as LFA (CEU, 2005).
B.7 Drivers of RDP strategy
Fit within national policy.
The RDP 2007-2013 for Flanders is written in accordance with the Flemish Reform Programme 2005-2008 (resulting from the Lisboa Strategy), the Flemish Action Plan for Organic Agriculture, the National Climate Plan 2002-2012, the Environmental Policy Plan 2003-2007 and the Flemish Action Plan for Sustainable Development. The RDP 2007-2013 for Wallonia is written in accordance with Action Plan for the Future of Wallonia and also in accordance with other regional (Wallonia) action plans.
C. Vision on the CAP beyond 2013*
C.1 Stages in the development of the CAP debate
Is there a debate about the CAP beyond 2013?
In Flanders such a debate has not yet been started.*
C.2 Key issues in the debate
No information.
* Information provided by Anneleen De Smedt, Minaraad van Vlaanderen.
D. Literature, sources, references
- Agra Europe (2007), "Threat of SFP cuts rises as NMS accede", Agra Europe Weekly, January 12
- Council of the European Union (CEU) (2005), Proposal for a Council Regulation on support for rural development by the European Agricultural Fund for Rural Development (EAFRD) – redefinition of intermediate less-favoured areas, Brussels, Working Party on Agricultural Structures and Rural Development, working document (7971/05), 15 April
- Council of the European Union (CEU) (2006), Council Regulation 1782/2003 (consolidated version - August 5, 2006), Annex VIII and VIIIa, Brussels
- Departement Landbouw en Visserij (2007), Programma voor Plattelandsontwikkeling Vlaanderen (20072013), version 23 October 2007
- European Commission (EC) (2006), 35th Financial Report on the European Agricultural Guidance and Guarantee Fund, Guarantee section, 2005 Financial Year, SEC(2006)1152
- European Commission (EC) (2007a), EU support for rural development 2007-2013; Pre-allocated funding under Heading 2 "Natural Resources" of the Financial Framework, Brussels: European Commission
- European Commission (EC) (2007b), Overview of the implementation of direct payments under the CAP in Member States Version February 2007, EC, DG for Agriculture and Rural Development
- Gouvernement Wallon (2007), Programme Wallon de Développement Rural 2007-2013, version November 2007
- IEEP (2005), The development and implementation of cross compliance in the EU15: an analysis. Report for the RSPB, Institute for European Environmental Policy
- Institut wallon de lévaluation, de la prospective et de la statistique (2006), Statistiques, statistiques.wallonie.be
- Ministerie van het Waalse Gewest van België (2005), De Waalse landbouw in cijfers, Namur
- Studiedienst van de Vlaamse regering (2006), Landbouwstatistieken voor Vlaanderen, Brussels, aps.vlaanderen.be/statistiek/cijfers/stat_cijfers_landbouw.htm.
- Vlaamse Overheid (2006), Landbouwrapport 2005, Brussels, www2.vlaanderen.be/ned/sites/landbouw/publicaties/volt/41.html
