Finland
• General country description
• A. First pillar: implementation of CAP reforms (2003)
• B. Second pillar: implementation of RDP measures during 2007-2013
• C. Vision for the CAP beyond 2013: a short overview of the debate (at Member State level) on future CAP reform
• D. Literature, sources, references
• The comparative analysis provides a compact overview of CAP implementation across all 27 Member States and their visions of the future of the CAP
General country discription
Finland |
Comparison with EU-25 |
Population, 2005 (*1,000,000): 5.2 |
1.1% of population in EU-25 |
Population density, 2003 (inh./km2): 17 |
118 in EU-25 |
GDP/capita, 2005 (PPS): 26,300 |
112% of GDP/capita in EU-25 |
Share agriculture in total employment, 2002 (%): 5 |
5% in EU-25 |
Share Utilized Agricultural Area in total land area, 2003 (%): 7 |
46% in EU-25 in 1998 |
Average farm size, 2005 (ha): 32 |
19 in EU-15 |
Number of farms, 2005 (*1000): 70.0 |
1.1% of farms in EU-25 |
Source: own calculations based on Eurostat
Distribution of farming types, 2005 (% of total)
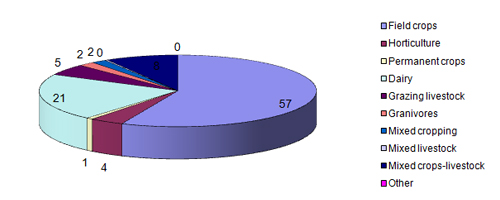
Source: own calculations based on Eurostat
EU funding for the Single Payment Scheme (SPS)
and the second pillar, 2007-2013
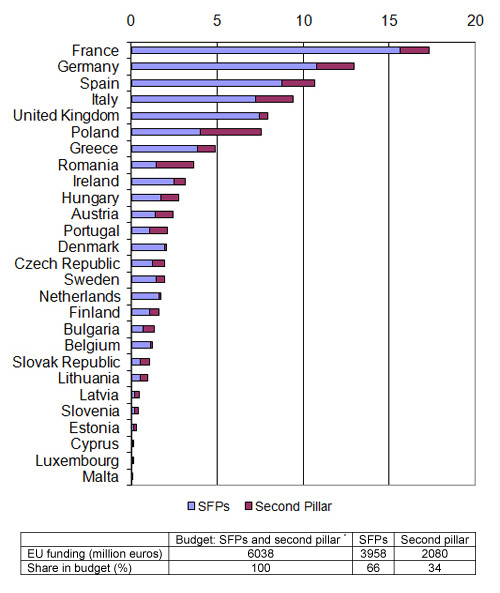
* Funding according to CAP budget including Bulgaria and Romania. Sources: Agra Europe (2007); CEU (2006); EC (2007a)
A. First pillar: implementation CAP reform (2003)
A.1 Single Payment Scheme
Model
SPS dynamic hybrid moving to a flat rate model (EC, 2007)
Coupling measures
Complete decoupling, except for sheep and goat premium (50%coupled), special male bovine premium (75% coupled). Article 69 application ( 2.1% of the ceiling for arable crops, 10% of the ceiling for the bovine sector, seeds (timothy seed), dairy premium in 2006.
Reason for selection
No information
A.2 EU budget for Single Payment Scheme (SPS) per year (National ceiling) 2005-2013
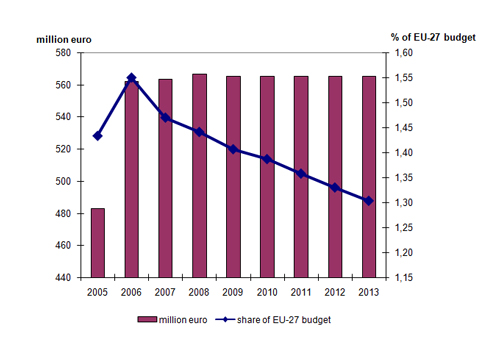
Source: 2005: EC (2006); 2006-2013: CEU (2006) and Agra Europe (2007)
Share of the farms that receive SPS of the total number of farms (% of total)
No information
Tradability of SPS
No information
A.3 Cross-compliance: Good Agricultural and Environmental Conditions (GAEC)
(Source: IEEP, 2005;)
Selected standards of the GAEC
Issue |
Standards |
Summary of farmers obligations |
Soil erosion |
minimum soil cover |
uncultivated cover (>= 60cm) or set-aside (3 m) along waterways; maintain green cover on land no longer in use for production and mow once every growing season. |
soil organic matter |
arable stubble management |
no burning |
soil structure |
appropriate machinery use |
restrictions on wet fields |
protection of permanent pastures |
|
Authorization required to convert permanent pasture. |
minimum level of maintenance |
retention of landscape features |
Groups of trees, bushes, rocks in fields must be retained |
|
|
Prevention of spreading wild oats |
Finland focuses on all issues, main concern is landscape and water protection.
Reason for selection of cross compliance standards
No information
A.4 Further reform of market regulations
No information
B. Second pillar: implementation of RDP measures 2007-2013
B.1 Programme level and approval
There is one national strategy for Finland and there are two Rural Development Programmes: one for Mainland Finland and one for the Region of Åland. The Rural Development Committee (consisting of representatives of the 27 Member States) has approved the RDP for Mainland Finland on 20 June 2007 and for the Region of Åland on 20 December 2007.
B.2 Distribution of public budget over the axes (%) 1)
|
axis 1: competitiveness |
axis 2: environment and land management |
axis 3: rural economy |
Axis 4: Leader |
Mainland Finland |
8 |
81 |
7 |
4 |
1) Figures excluding Technical Assistance
Source: Own calculations based on Ministry of Agriculture and Forestry (2007)
B.3 Integration of Leader in axes 1, 2 and 3
Axis 4 combines the objectives of Axes 1, 2 and 3 with the methodological approach of the Leader activities.
B.4 Local Action Groups (LAGs)
In the previous programming period (2000-2006) there were 25 LAGs in Finland. In the period 2007-2013 it is intended to create 50-58 LAGs, covering about 300,000-350,000 km2.
B.5 RDP budget 2007-2013 (million euros)
|
total public budget |
% co-financing EAFRD1) |
EAFRD budget |
Contribution private sector |
Total costs |
National top-ups |
Mainland Finland |
6625.7 |
31 |
2062.5 |
782.3 |
7408.0 |
140.0 |
Total Finland |
|
|
2079.9 |
|
|
|
1) % of co-financing may vary per axis Source: Ministry of Agriculture and Forestry (2007)
B.6 Less Favoured Areas
In 2005 2,231,000 ha (100% of UAA) was designed as Less Favoured Areas (LFA) (CEU, 2005).
B.7 Drivers of RDP strategy
Fit within national policy.
The Finnish RDP is written in accordance with Finland's national rural policy (in place since the late 1980s), the National Forest Programme 2010, the Industrial Policy Programme for the Wood Products Industry and the Programme for Promoting Wood Building. The latter three are the national instruments which implement the EU Forest Strategy.
C. Vision on the CAP beyond 2013*
C.1 Stages in the development of the CAP debate
Is there a debate about the CAP beyond 2013?
Yes, there is a debate in Finland among the Ministry of Agriculture, government, parliament members, political parties, farmers' organization, agri-business cooperatives, research institutes and universities.
C2 Key issues in the debate
Components and role of the CAP
- Provisions should be made to secure the survival of efficient milk producers in case of an abolition of the milk quotas;
- Elimination of the intervention system or price support and export refunds on agricultural production in Finland, especially for the dairy sector;
- The impact of full decoupling of direct payments on beef production and crops in Finland;
- Abolishing the link between the historical reference yields and the level of CAP arable land payments, resulting in a European wide flat rate for the arable land payments?
Organisation of the CAP (first an second pillar)
- The increased role of Pillar 2 due to the diminishing role of Pillar 1;
- The future of the agri-environmental policies under Pillar 2;
- The future of Finnish agriculture and the balanced development of the countryside and remote rural areas.
Financing of the CAP
- The effect of a reduction of the CAP budget on direct payments and agriculture production?
- Allocation of the budget cuts between Pillars 1 and 2;
- The role of modulation and its impact;
- The possible co-financing of CAP budget (re-nationalization of the CAP).
D. Literature, sources, references
- Agra Europe (2007), "Threat of SFP cuts rises as NMS accede", Agra Europe Weekly, January 12
- Council of the European Union (CEU) (2005), Proposal for a Council Regulation on support for rural development by the European Agricultural Fund for Rural Development (EAFRD) - redefinition of intermediate less-favoured areas, Brussels, Working Party on Agricultural Structures and Rural Development, working document (7971/05), 15 April
- Council of the European Union (CEU) (2006), Council Regulation 1782/2003 (consolidated version - August 5, 2006), Annex VIII and VIIIa, Brussels
- European Commission (EC) (2006), 35th Financial Report on the European Agricultural Guidance and Guarantee Fund, Guarantee section, 2005 Financial Year, SEC(2006)1152
- European Commission (EC) (2007a), EU support for rural development 2007-2013; Pre-allocated funding under Heading 2 "Natural Resources" of the Financial Framework, Brussels:
- European Commission European Commission (EC) (2007b), Overview of the implementation of direct payments under the CAP in Member States Version February 2007, EC, DG for Agriculture and Rural Development
- IEEP (2005), The development and implementation of cross compliance in the EU15: an analysis. Report for the RSPB, Institute for European Environmental Policy
- Ministry of Agriculture and Forestry (2007), Rural Development Programme for Mainland Finland 2007-2013 (Manner-Suomen maaseudun Kehittämisohjelma 2007-2013), English version 17 July 2007
