Ireland
• General country description
• A. First pillar: implementation of CAP reforms (2003)
• B. Second pillar: implementation of RDP measures during 2007-2013
• C. Vision for the CAP beyond 2013: a short overview of the debate (at Member State level) on future CAP reform
• D. Literature, sources, references
• The comparative analysis provides a compact overview of CAP implementation across all 27 Member States and their visions of the future of the CAP
General country discription
Ireland |
Comparison with EU-25 |
Population, 2005 (*1,000,000): 4.1 |
0.9% of population in EU-25 |
Population density, 2003 (inh./km2): 58 |
118 in EU-25 |
GDP/capita, 2005 (PPS): 32,299 |
138% of GDP/capita in EU-25 |
Share agriculture in total employment, 2002 (%): 7 |
5% in EU-25 |
Share Utilized Agricultural Area in total land area, 2003 (%): 653 |
46% in EU-25 in 1998 |
Average farm size, 2005 (ha): 33 |
19 in EU-15 |
Number of farms, 2005 (*1000): 125.5 |
1.9% of farms in EU-25 |
Source: own calculations based on Eurostat
Distribution of farming types, 2005 (% of total)
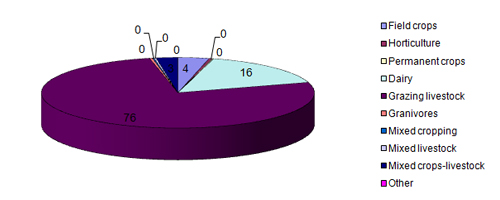
Source: own calculations based on Eurostat
EU funding for the Single Payment Scheme (SPS)
and the second pillar, 2007-2013
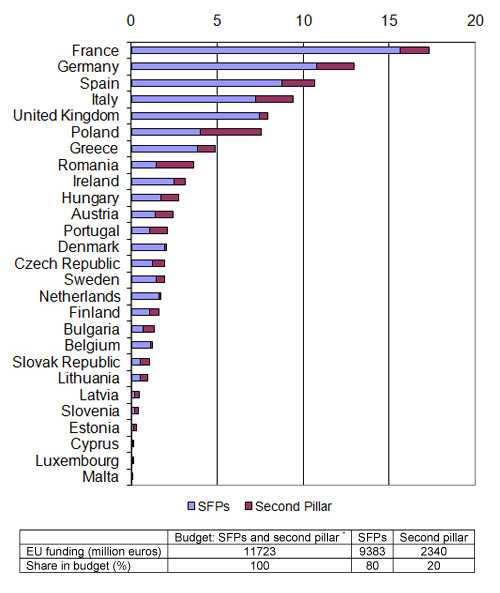
Funding according to CAP budget including Bulgaria and Romania.
Sources: Agra Europe (2007); CEU (2006); EC (2007a)
A. First pillar: implementation CAP reform (2003)
A.1 Single Payment Scheme
Model
SFP historical (EC, 2007b)
Coupling measures
Complete decoupling, dairy premium in 2005.
Reason for selection
No information
A.2 EU budget for Single Payment Scheme (SPS) per year (National ceiling) 2005-2013
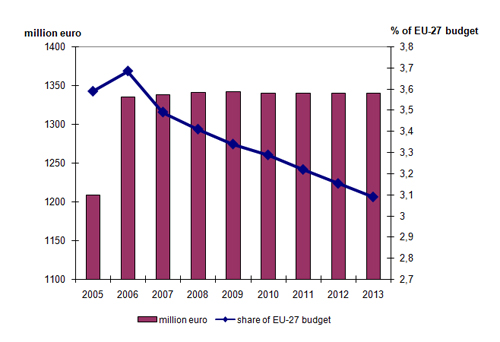
Source: 2005: EC (2006); 2006-2013: CEU (2006) and Agra Europe (2007)
Share of the farms that receive SPS of the total number of farms (% of total)
No information
Tradability of SPS
No information
A.3 Cross-compliance: Good Agricultural and Environmental Conditions (GAEC)
(Source: IEEP, 2005,)
Selected standards of the GAEC
Issue |
Standards |
Comment (IEEP)
|
Soil erosion |
minimum soil cover |
ensure soil is covered; animal management outdoors must prevent severe poaching or overgrazing, especially on hill sides and sand dunes; if on common land the Commonage Framework Plan is valid. |
|
minimum land management reflecting site-specific conditions |
keep in readily utilisable condition by appropriate grazing and/or cutting management except if nationally required for environmental protection. |
|
retain terraces |
|
|
EXTRA: assess real and potential risk to soil erosion |
|
soil organic matter |
standards for crop rotation where applicable |
use of appropriate cropping rotations or practices where necesarry |
arable stubble management |
current practices (ploughing in) are adequate |
|
soil structure |
appropriate machinery use |
not on land with surface water of saturated soil |
protection of permanent pastures |
|
corrections depending on degree of decrease (5 or 10%) |
minimum level of maintenance |
minimum livestock stocking rates or/and appropriate regimes |
in LFA max of 0.15 LU/ha. If undergrazing is a fact, various options are available (e.g. increase stocking rate, harvest hay or silage ) |
|
retention of landscape features |
if protected under national or EU legislation; vegetation in compliance with the Wildlife acts (1976 and 2000) and habitats under national or EU legislation |
|
avoiding the encroachment of unwanted vegetation on agricultural land |
prevent establishment of invasive species or noxious weeds that ensure land can be used for agricultural purpose |
Ireland pays attention to all issues of GAEC and has elaborated standards. Attention is paid that land remains in readily utilisable agricultural condition.
Reason for selection of cross compliance standards
No information.
A.4 Further reform of market regulations
No information
B. Second pillar: implementation of RDP measures 2007-2013
B.1 Programme level and approval
There is one national RDP for Ireland. The Rural Development Committee (consisting of representatives of the 27 Member States) has approved the RDP for Ireland on 25 July 2007.
B.2 Distribution of public budget over the axes (%) 1)
axis 1: competitiveness |
axis 2: environment and land management |
axis 3: rural economy |
Axis 4: Leader |
11 |
79 |
10 |
0 |
1) Figures excluding Technical Assistance; Axis 3 measures are to be implemented using the Leader (axis 4) approach
Source: own calculations based on Department of Agriculture and Food (2007)
B.3 Integration of Leader in axes 1, 2 and 3
Leader contributes to Axis 3; Axis 3 and Leader are jointly implemented.
B.4 Local Action Groups (LAGs)
It is intended to create 35 territorial LAGs and 3 representative organisations (in the period 2000-2006 there were 22 LAGs).
B.5 RDP budget 2007-2013 (million euros)
total public budget |
% co-financing EAFRD1) |
EAFRD budget |
Contribution private sector |
Total costs |
National top-ups |
4298.8 |
54 |
2339.9 |
272.0 |
4515.8 |
1480.0 |
1) % of co-financing may vary per axis
Source: Department of Agriculture and Food (2007)
B.6 Less Favoured Areas
In 2005 Ireland had designed 1.1 million ha as Less Severely Handicapped and Coastal Areas, 4.1 million ha as More Severely Handicapped Areas and 27,000 ha as Mountain Type Grazings. This differs from other data on 2005, when total LFA in Ireland was 2,331,000 ha (48% of UAA) (CEU, 2005).
B.7 Drivers of RDP strategy
The RDP 2007-2013 for Ireland is written in accordance with and complementary to the National Spatial Strategy (NSS).
C. Vision on the CAP beyond 2013
No information
D. Literature, sources, references
- Agra Europe (2007), "Threat of SFP cuts rises as NMS accede", Agra Europe Weekly, January 12
- Council of the European Union (CEU) (2005), Proposal for a Council Regulation on support for rural development by the European Agricultural Fund for Rural Development (EAFRD) - redefinition of intermediate less-favoured areas, Brussels, Working Party on Agricultural Structures and Rural Development, working document (7971/05), 15 April
- Council of the European Union (CEU) (2006), Council Regulation 1782/2003 (consolidated version - August 5, 2006), Annex VIII and VIIIa, Brussels
- Department of Agriculture and Food (2007), Rural Development Programme Ireland 2007-2013, final version
- European Commission (EC) (2006), 35th Financial Report on the European Agricultural Guidance and Guarantee Fund, Guarantee section, 2005 Financial Year, SEC(2006)1152
- European Commission (EC) (2007a), EU support for rural development 2007-2013; Pre-allocated funding under Heading 2 "Natural Resources" of the Financial Framework, Brussels: European Commission
- European Commission (EC) (2007b), Overview of the implementation of direct payments under the CAP in Member States Version February 2007, EC, DG for Agriculture and Rural Development
- IEEP (2005), The development and implementation of cross compliance in the EU15: an analysis. Report for the RSPB, Institute for European Environmental Policy
