Italy
• General country description
• A. First pillar: implementation of CAP reforms (2003)
• B. Second pillar: implementation of RDP measures during 2007-2013
• C. Vision for the CAP beyond 2013: a short overview of the debate (at Member State level) on future CAP reform
• D. Literature, sources, references
• The comparative analysis provides a compact overview of CAP implementation across all 27 Member States and their visions of the future of the CAP
General country discription
Italy |
Comparison with EU-25 |
Population, 2005 (*1,000,000): 58.5 |
12.7% of population in EU-25 |
Population density, 2003 (inh./km2): 191 |
118 in EU-25 |
GDP/capita, 2005 (PPS): 24,200 |
103% of GDP/capita in EU-25 |
Share agriculture in total employment, 2002 (%): 5 |
5% in EU-25 |
Share Utilized Agricultural Area in total land area, 2003 (%): 51 |
46% in EU-25 in 1998 |
Average farm size, 2005 (ha): 9 |
19 in EU-15 |
Number of farms, 2005 (*1000): 1380.3 |
21.8% of farms in EU-25 |
Source: own calculations based on Eurostat
Distribution of farming types, 2005 (% of total)
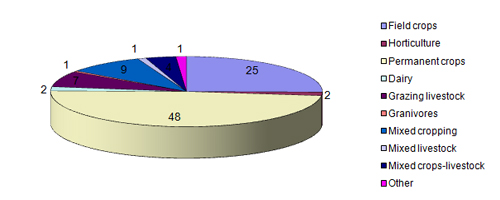
Source: own calculations based on Eurostat
EU funding for the Single Payment Scheme (SPS)
and the second pillar, 2007-2013
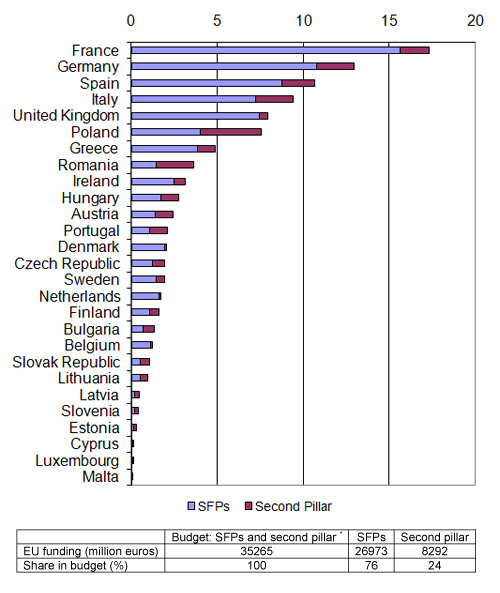
Funding according to CAP budget including Bulgaria and Romania.
Sources: Agra Europe (2007); CEU (2006); EC (2007a)
A. First pillar: implementation CAP reform (2003)
A.1 Single Payment Scheme
Model
SPS historical (EC, 2007b)
Coupling measures
Complete decoupling, except for seeds (100% coupled). Application of Article 69 for quality production ( 8% of the ceiling for the arable sector, 7% of the ceiling for the bovine sector, 5% of the ceiling for the sheep and goat sector), dairy premium in 2006.
Reason for selection
No information
A.2 EU budget for Single Payment Scheme (SPS) per year (National ceiling) 2005-2013
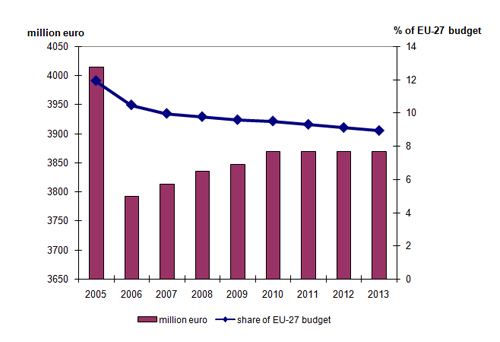
Source: 2005: EC (2006); 2006-2013: CEU (2006) and Agra Europe (2007)
Share of the farms that receive SPS of the total number of farms (% of total)
No information
Tradability of SPS
No information
A.3 Cross-compliance: Good Agricultural and Environmental Conditions (GAEC)
Source: IEEP, 2005
Selected standards of the GAEC
Issue |
Standards |
Summary of farmers obligations |
Soil erosion |
Minimum soil cover |
related to agricultural land no longer in use |
|
minimum land management reflecting site-specific conditions |
Avoidance of temporary chanelling of surface water on sloping land (only on arable and set aside, not on pastures or permanent crops) |
|
retain terraces |
Maintain terraces |
soil organic matter |
arable stubble management |
no burning. Stricter regional rules possible (period) |
soil structure |
EXTRA: irrigation standards / water management |
maintain drainage system in good working condition, but subordinated to Natura 2000 management requirements if relevant. |
protection of permanent pastures |
|
protection |
minimum level of maintenance |
minimum livestock stocking rates or/and appropriate regimes |
regionally specified levels |
|
retention of landscape features |
respect regional legislation to protect Natura 2000 regions. Stricter regional legislation allowed. |
|
EXTRA: agricultural land no longer in use |
soil covered the whole year, to avoid abandonment and keep soil fertility. |
|
EXTRA: maintenance of olive grooves |
prune trees at least every five years, but stricter regional legislation allowed. |
Italy pays attention to all issues of GAEC. For almost all standards regions can apply stricter rules than national or European legislation.
Reason for selection of cross compliance standards
No information
A.4 Further reform of market regulations
- Article 69 application: 8% of the ceiling for sugar;
- 5% deduction in the olive sector for funding of programmes established by producer organizations;
- Annex VII point H and I: olive coefficient for decoupling is increased to 1, tobacco coefficient for decoupling is 0.4, for the region Puglia, the decoupling coefficient for tobacco is 100% (EC, 2007b).
B. Second pillar: implementation of RDP measures 2007-2013
B.1 Programme level and approval
There is one national strategy and there are 21 regional RDPs. All regional RDPs have been approved. The Rural Development Committee (consisting of representatives of the 27 Member States) has approved two regional RDPs on 25 July 2007, three on 20 September 2007, three on 25 October 2007, four on 21 November 2007, four on 20 December 2007, four on 24 January 2008 and the last one on 20 February 2008.
B.2 Distribution of public budget over the axes (%) 1)
|
axis 1: competitiveness |
axis 2: environment and land management |
axis 3: rural economy |
Axis 4: Leader |
Abruzzo |
45 |
39 |
11 |
5 |
Basilicata |
27 |
56 |
10 |
6 |
Prov. Aut. di Bolzano |
24 |
62 |
9 |
5 |
Calabria |
42 |
42 |
10 |
6 |
Campania |
43 |
36 |
16 |
5 |
Emilia-Romagna |
41 |
43 |
11 |
5 |
Friuli Venezia Giulia |
45 |
38 |
10 |
7 |
Lazio |
49 |
33 |
13 |
6 |
Liguria |
53 |
21 |
6 |
20 |
Lombardia |
33 |
53 |
9 |
4 |
Marche |
44 |
40 |
9 |
6 |
Molise |
45 |
35 |
15 |
5 |
Piemonte |
40 |
46 |
8 |
6 |
Puglia |
46 |
31 |
17 |
6 |
Sardegna |
28 |
57 |
1 |
14 |
Sicilia |
46 |
43 |
6 |
6 |
Toscana |
39 |
40 |
11 |
10 |
Prov. Aut. di Trento |
34 |
47 |
12 |
7 |
Umbria |
41 |
44 |
9 |
5 |
Valle dAosta |
10 |
71 |
11 |
8 |
Veneto |
45 |
38 |
5 |
11 |
Figures excluding Technical Assistance
Source: Own calculations based on Ministero delle Politiche Agricole Alimentari e Forestali (2006) and regional RDPs (for references see part D)
B.3 Integration of Leader in axes 1, 2 and 3
Leader contributes to Axis 3.
B.4 Local Action Groups (LAGs)
No information, the number of LAGs in the previous period was 132.
B.5 RDP budget 2007-2013 (million euros)
|
Total public budget |
% co-financing EAFRD 1) |
EAFRD budget |
Contribution private sector |
Total costs |
National top-ups |
Abruzzo |
383.9 |
44 |
168.9 |
191.8 |
575.9 |
0 |
Basilicata |
648.1 |
58 |
372.7 |
184.8 |
832.9 |
0 |
Prov. Aut. di Bolzano |
312.7 |
44 |
137.6 |
84.4 |
397.1 |
104.8 |
Calabria |
1084.1 |
58 |
623.3 |
394.5 |
1478.5 |
40.0 |
Campania |
1882.3 |
58 |
1082.3 |
592.7 |
2362.2 |
0 |
Emilia-Romagna |
934.7 |
44 |
411.3 |
525.4 |
1460.0 |
10.0 |
Friuli Venezia Giulia |
247.2 |
44 |
108.8 |
224.8 |
472.0 |
56.5 |
Lazio |
655.4 |
44 |
288.4 |
332.8 |
988.2 |
70.0 |
Liguria |
276.5 |
38 |
106.0 |
163.4 |
439.9 |
0 |
Lombardia |
899.8 |
44 |
395.9 |
596.4 |
1496.2 |
0 |
Marche |
459.8 |
44 |
202.3 |
286.1 |
745.9 |
30.0 |
Molise |
195.0 |
44 |
85.8 |
81.3 |
276.2 |
0 |
Piemonte |
896.6 |
44 |
394.5 |
320.3 |
1216.9 |
132.6 |
Puglia |
1480.6 |
58 |
851.3 |
641.9 |
2122.4 |
0 |
Sardegna |
1252.8 |
44 |
551.3 |
313.1 |
1566.0 |
0 |
Sicilia |
2106.4 |
58 |
1211.2 |
781.5 |
2887.9 |
66.0 |
Toscana |
839.1 |
44 |
369.2 |
493.9 |
1333.1 |
6.0 |
Prov. Aut. di Trento |
256.2 |
39 |
100.7 |
99.1 |
355.2 |
243.5 |
Umbria |
760.1 |
44 |
334.4 |
284.5 |
1044.5 |
14.7 |
Valle d'Aosta |
118.7 |
44 |
52.2 |
7.7 |
126.4 |
51.7 |
Veneto |
914.7 |
44 |
402.5 |
575.1 |
1489.8 |
80.0 |
Total Italy |
16604.7 |
|
8292.0 |
7175.5 |
23667.2 |
905.8 |
1) % of co-financing may vary per axis
Source: Ministero delle Politiche Agricole Alimentari e Forestali (2006) and regional RDPs (for references see part D)
B.6 Less Favoured Areas
In 2005 total Less Favoured Areas (LFA) in Italy was 6,724,000 ha (41% of UAA) (CEU, 2005).
B.7 Drivers of RDP strategy
No information
C. Vision on the CAP beyond 2013*
C.1 Stages in the development of the CAP debate
Is there a debate about the CAP beyond 2013?
The debate is starting now, induced by the start of the Health Check analysis. Government (national/regional), farmers organizations, cooperatives organizations, consumers organizations, environmental agencies and NGOs are involved in the debate.
C. 2 Key issues in the debate
Components and role of the CAP (Agra Europe, 2007; Financial Times, 2007)
- Likely there will be a division between the agricultural representatives. On the one hand, Coldiretti (the largest farmers Union) is progressive and supports a full decoupling, modulation, increase in Pillar 2 and better finalization towards entrepreneurship, diversification and competitiveness. On the other hand, Confagricoltura (landowners and big farmers) and CIA (once the left farmers union) are more conservative;
- The Prodi-De Castro Government is likely more open to changes and for support of territorial rural development approach;
- Transition of a distributive approach towards a targeted approach, aiming at the 3Es (efficiency, effectiveness, equity), both in Pillar 1 and 2. This means being selective, and to concentrate resources on specific targets;
- A discussion on agro-environmental measures: should they be reserved for entrepreneurs (internalizing the value of public goods) or should they be distributed 'as the rain' here and there?
Organization of the CAP (1st and 2nd pillar)
- A gradual increase in the role of Pillar 2 and a reduction of Pillar 1;
- Better integration of Pillar 2 into the regional development policy, especially in convergence regions.
Financing of the CAP (Agra Europe, 2007)
- A reduction of the Pillar 1 budget and more money for Pillar 2;
- Better coordination between the national and the regional governments in both the policy design and the management of the budget; More selection and targeting.
* Information provided by Franco Sotte, Universita' Politecnica delle Marche, Dipartimento di Economia, Ancona.
D. Literature, sources, references
- Agra Europe (2007), "Threat of SFP cuts rises as NMS accede", Agra Europe Weekly, January 12
- Council of the European Union (CEU) (2005), Proposal for a Council Regulation on support for rural development by the European Agricultural Fund for Rural Development (EAFRD) - redefinition of intermediate less-favoured areas, Brussels, Working Party on Agricultural Structures and Rural Development, working document (7971/05), 15 April
- Council of the European Union (CEU) (2006), Council Regulation 1782/2003 (consolidated version - August 5, 2006), Annex VIII and VIIIa, Brussels
- European Commission (EC) (2006), 35th Financial Report on the European Agricultural Guidance and Guarantee Fund, Guarantee section, 2005 Financial Year, SEC(2006)1152
- European Commission (EC) (2007a), EU support for rural development 2007-2013; Pre-allocated funding under Heading 2 "Natural Resources" of the Financial Framework, Brussels: European Commission
- European Commission (EC) (2007b), Overview of the implementation of direct payments under the CAP in Member States Version November 2007, EC, DG for Agriculture and Rural Development
- IEEP (2005), The development and implementation of cross compliance in the EU15: an analysis. Report for the RSPB, Institute for European Environmental Policy
- Ministero delle Politiche Agricole Alimentari e Forestali (2006), Piano Strategico Nazionale per lo Sviluppo Rurale, version 21 December 2006
