Greece
• General country description
• A. First pillar: implementation of CAP reforms (2003)
• B. Second pillar: implementation of RDP measures during 2007-2013
• C. Vision for the CAP beyond 2013: a short overview of the debate (at Member State level) on future CAP reform
• D. Literature, sources, references
• The comparative analysis provides a compact overview of CAP implementation across all 27 Member States and their visions of the future of the CAP
General country discription
Greece |
Comparison with EU-25 |
Population, 2005 (*1,000,000): 11.1 |
2.4% of population in EU-25 |
Population density, 2003 (inh./km2): 84 |
118 in EU-25 |
GDP/capita, 2005 (PPS): 19,600 |
54% of GDP/capita in EU-25 |
Share agriculture in total employment, 2002 (%): 16 |
5% in EU-25 |
Share Utilized Agricultural Area in total land area, 2003 (%): 29 |
46% in EU-25 in 1998 |
Average farm size, 2005 (ha): 6 |
19 in EU-15 |
Number of farms, 2005 (*1000): 678.2 |
10.0% of farms in EU-25 |
Source: own calculations based on Eurostat
Distribution of farming types, 2005 (% of total)
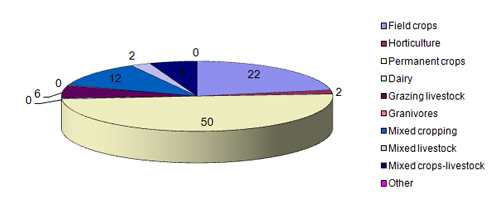
Source: own calculations based on Eurostat
EU funding for the Single Payment Scheme (SPS)
and the second pillar, 2007-2013
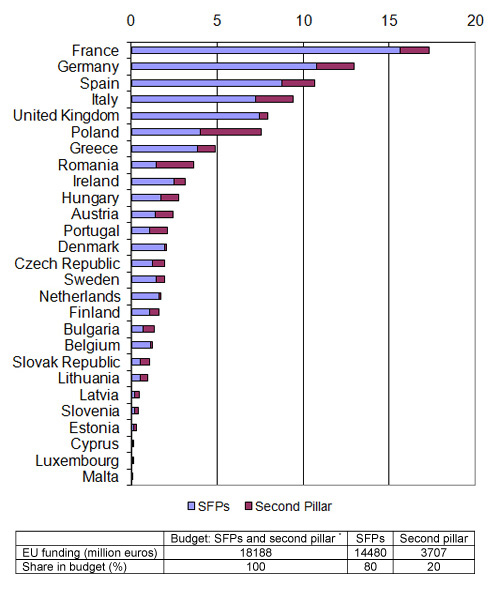
Funding according to CAP budget including Bulgaria and Romania.
Sources: Agra Europe (2007); CEU (2006); EC (2007a)
A. First pillar: implementation CAP reform (2003)
A.1 Single Payment Scheme
Model
SPS historical (EC, 2007b).
Coupling measures
Complete decoupling. Application of article 69: 10% of the ceiling for arable crops and the beef sector and 5% of the ceiling for the sheep and goat sector, dairy premium in 2007.
Reason for selection
No information.
A.2 EU budget for Single Payment Scheme (SPS) per year (National ceiling) 2005-2013
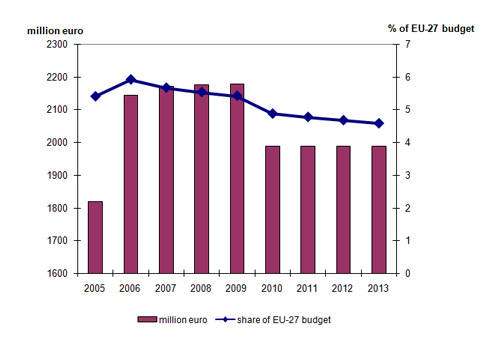
Source: 2005: EC (2006); 2006-2013: CEU (2006) and Agra Europe (2007)
Share of the farms that receive SPS of the total number of farms (% of total)
No information.
Tradability of SPS
No information.
A.3 Cross-compliance: Good Agricultural and Environmental Conditions (GAEC)
(Source IEEP, 2005; )
Issue |
Standards |
Summary of farmers' obligations |
Soil erosion |
Minimum soil cover |
maintenance of green cover during wet period (if slope>10%) |
|
minimum land management reflecting site-specific conditions |
control on tillage on slopes; fertilizer management (application period, dosage, restriction near water bodies); special provisions for acid or hilly soils, areas under Nitrate or habitat Directive and water resource exhaustion areas |
|
retain terraces |
Terraces should not be destroyed |
Soil organic matter |
standards for crop rotation where applicable |
20% of the arable land has to be cultivated with grain legumes |
|
arable stubble management |
incorporate residue into ground if low organic matter; is also fire hazard protection. Burning only permitted in exceptional cases |
|
EXTRA: irrigation standards / water management |
|
|
minimum livestock stocking rates or/and appropriate regimes |
limitations of periods for grazing and cutting, no grazing in burned or afforested areas, regionally specified limited stocking rates; waste management, no fires allowed for grass regeneration |
|
protection of permanent pastures |
no ploughing without authorization |
|
retention of landscape features |
including wildlife and biodiversity |
Greece pays attention to all issues of GAEC and differentiates standards for arable land and areas for livestock production. Regionally specified rules, including EU-legislation for nitrate and habitats.
Reason for selection of cross compliance standards
No information.
A.4 Further reform of market regulations
Decoupling of other products, like tobacco, hop etc.
- 2% of the ceiling for tobacco,
- 4% of the ceiling for olive oil.
B. Second pillar: implementation of RDP measures 2007-2013*
B.1 Programme level and approval
There is one RDP for Greece. The Rural Development Committee (consisting of representatives of the 27 Member States) has approved the RDP for Greece on 21 November 2007.
B.2 Distribution of public budget over the axes (%)1)
axis 1: competitiveness |
axis 2: environment and land management |
axis 3: rural economy |
Axis 4: Leader |
45 |
34 |
14 |
6 |
1) Figures excluding Technical Assistance
Source: Own calculations based on information provided by the Ministry of Rural Development and Food of Greece
B.3 Integration of Leader in axes 1, 2 and 3
Leader is integrated in Axis 3, as it was in the programming period 2000-2006.
B.4 Local Action Groups (LAGs)
In the previous programming period (2000-2006) 40 LAGs were created in Greece. The number of LAGs for the period 2007-2013 is not yet determined. Leader axis 4 will cover 65% of the country.
B.5 RDP budget 2007-2013 (million euros)
total public budget |
% co-financing EAFRD1) |
EAFRD budget |
Contribution private sector |
Total costs |
National top-ups |
5078.0 |
73 |
3707.3 |
1447.5 |
6525.4 |
0 |
1) % of co-financing may vary per axis
Source: EC (2007a) and information provided by the Ministry of Rural Development and Food of Greece
B.6 Less Favoured Areas
In 2005 6,903,000 ha was designed as Less Favoured Area (LFA) (83% of UAA) (CEU, 2005).
B.7 Drivers of RDP strategy
No information.
* This part is largely based on information provided by Sotiris Koutsomitros and Paraskevi Dilana, Ministry of Rural Development and Food of Greece, Athens.
C. Vision on the CAP beyond 2013*
C.1 Stages in the development of the CAP debate
Is there a debate about the CAP beyond 2013?
No, such a debate has not yet started in Greece.
C2 Key issues in the debate
No information.
* Information provided by Sotiris Koutsomitros, Hellenic Ministry of Rural Development and Food.
D. Literature, sources, references
- Agra Europe (2007), "Threat of SFP cuts rises as NMS accede", Agra Europe Weekly, January 12
- Council of the European Union (CEU) (2005), Proposal for a Council Regulation on support for rural development by the European Agricultural Fund for Rural Development (EAFRD) – redefinition of intermediate less-favoured areas, Brussels, Working Party on Agricultural Structures and Rural Development, working document (7971/05), 15 April
- Council of the European Union (CEU) (2006), Council Regulation 1782/2003 (consolidated version - August 5, 2006), Annex VIII and VIIIa, Brussels
- European Commission (EC) (2006), 35th Financial Report on the European Agricultural Guidance and Guarantee Fund, Guarantee section, 2005 Financial Year, SEC(2006)1152
- European Commission (EC) (2007a), EU support for rural development 2007-2013; Pre-allocated funding under Heading 2 "Natural Resources" of the Financial Framework, Brussels: European Commission
- European Commission (EC) (2007b), Overview of the implementation of direct payments under the CAP in Member States Version February 2007, EC, DG for Agriculture and Rural Development
- IEEP (2005), The development and implementation of cross compliance in the EU15: an analysis. Report for the RSPB, Institute for European Environmental Policy
