Portugal
• General country description
• A. First pillar: implementation of CAP reforms (2003)
• B. Second pillar: implementation of RDP measures during 2007-2013
• C. Vision for the CAP beyond 2013: a short overview of the debate (at Member State level) on future CAP reform
• D. Literature, sources, references
• The comparative analysis provides a compact overview of CAP implementation across all 27 Member States and their visions of the future of the CAP
General country discription
Portugal |
Comparison with EU-25 |
Population, 2005 (*1,000,000): 10.5 |
2.3% of population in EU-25 |
Population density, 2003 (inh./km2): 114 |
118 in EU-25 |
GDP/capita, 2005 (PPS): 16,600 |
71% of GDP/capita in EU-25 |
Share agriculture in total employment, 2002 (%): 10 |
5% in EU-25 |
Share Utilized Agricultural Area in total land area, 2003 (%): 43 |
46% in EU-25 in 1998 |
Average farm size, 2005 (ha): 16 |
19 in EU-15 |
Number of farms, 2005 (*1000): 219.3 |
3.4% of farms in EU-25 |
Source: own calculations based on Eurostat
Distribution of farming types, 2005 (% of total)
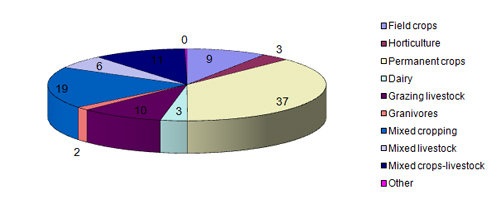
Source: own calculations based on Eurostat
EU funding for the Single Payment Scheme (SPS)
and the second pillar, 2007-2013
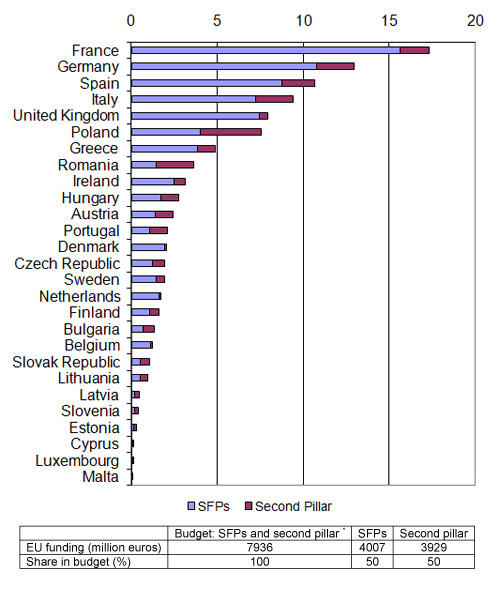
Funding according to CAP budget including Bulgaria and Romania.
Sources: Agra Europe (2007); CEU (2006); EC (2007a)
A. First pillar: implementation CAP reform (2003)
A.1 Single Payment Scheme
Model
SPS historical (EC, 2007b)
Coupling measures
Complete decoupling, except for suckler cow premium (100% coupled), slaughter premium calves (100% coupled), slaughter premium bovine adults (40% coupled), sheep and goat premium 50%, seeds (100% coupled), outermost regions (100% coupled). Article 69 application (1% arable crops, rice, bovine and ovine sectors), dairy premium in 2007.
Reason for selection
- no reallocation of historical distribution of payments in order to prevent income effects;
- partly coupling in order to maintain certain types of production;
- partly coupling in order to prevent land abandonment.
A.2 EU budget for Single Payment Scheme (SPS) per year (National ceiling) 2005-2013
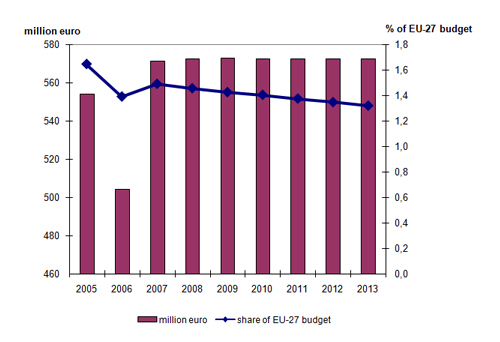
Source: 2005: EC (2006); 2006-2013: CEU (2006) and Agra Europe (2007)
Share of the farms that receive SPS of the total number of farms (% of total)
70%
Tradability of SPS
Yes, single payments attached to land (if not, 10% are retained to the national reserve)
A.3 Cross-compliance: Good Agricultural and Environmental Conditions (GAEC)
(Source:IEEP 2005; )
Selected standards of the GAEC
Issue |
Standards |
Summary of farmersobligations |
Soil erosion |
Minimum soil cover |
all parcels in autumn and winter. Restrictions depend on plot physiographic qualification index (national legislation) |
Soil organic matter |
Stubble management |
Burning only permitted when authorized and only with technical advice and in periods of low fire risk |
Protection of permanent pasture |
|
Authorization required for converting pp and only possible if the national reference ratio remains above 95%. |
minimum level of maintenance |
avoiding the encroachment of unwanted vegetation on agricultural land |
max 25% of area occupied by woody plants of > 50 cm high |
|
EXTRA: environmental conditions |
set-aside and grasslands have at least 3m strips to be mowed 1x year; restricted bush fires; collection of agricultural residues; strong fertilisers and plant health products safely and dry at distances > 10 m from water bodies |
Portugal is mainly concerned about the environment and quality of water bodies and imposes national legislation for protection. Although land abandonment is a major problem, no standards or formulated to prevent it.
Reason for selection of cross compliance standards
The ministry did not comment on the development of cross compliance and did not state whether a consultation process took place or not.
A.4 Further reform of market regulations
Wine
Continuing the effort to reconvert vineyards towards competitiveness; selective grubbing to maintain vineyards in traditional wine regions, connected to environmental and landscape benefits; assuring sufficient and competitive supply of alcohol to Port and Madeira wine.
Fruit and vegetables
Already reformed (in tomato, the main concern was to maintain output levels and the existing tomato processing capability through partial decoupling; in general, to increase the level of organization of producers through the continuation of support to POs. Decision made in Agricultural Council meeting in June 2007. Complete decoupling of processing of fruit and vegetables within 4 years for tomatoes and within 5 years for permanent crops (e.g. citrus). Role of producer organisation strengthened, especially in crisis prevention and -management.
Decoupling of other products, like tobacco, hop etc.
Art. 69 application: 10% of the ceiling for the olive oil sector, 10% of the ceiling for sugar, tobacco coefficient for decoupling 0,5, olive oil coefficient for decoupling 1
Simplification into one market regulation
No information
B. Second pillar: implementation of RDP measures 2007-2013
B.1 Programme level and approval
There is one national strategy and there are three RDPs: one for Mainland Portugal and two for each Autonomous Region (Madeira and the Azores). The Rural Development Committee (consisting of representatives of the 27 Member States) has approved the RDP for Mainland Portugal on 21 November 2007.
B.2 Distribution of public budget over the axes (%)1)
|
axis 1: competitiveness |
axis 2: environment and land management |
axis 3: rural economy |
Axis 4: Leader |
Mainland Portugal |
48 |
41 |
0.1 |
11 |
1) Figures excluding Technical Assistance
Source: Own calculations based on Ministério da Agricultura, do Desenvolvimento Rural e das Pescas (2007)
B.3 Integration of Leader in axes 1, 2 and 3
Leader contributes to Axis 3. In addition, Leader should contribute to the improvement of new approaches to governance and to the mobilization of the endogenous development of local sources and actors.
B.4 Local Action Groups (LAGs)
According to an assessment by the LEADER+ the number of LAGs should be less than 46 to encourage an increase in the critical mass of certain areas. The LAGs should cover 100% of the rural areas (76.828 km2) (Ministério da Agricultura, do Desenvolvimento Rural e das Pescas, 2007). In 2000-2006 there were 52 LAGs in Portugal.
B.5 RDP budget 2007-2013 (million euros)
|
total public budget |
% co-financing EAFRD1) |
EAFRD budget |
Contribution private sector |
Total costs |
National top-ups |
Mainland Portugal |
4444.0 |
78 |
3468.1 |
1980.5 |
6424.4 |
0 |
Total Portugal |
|
|
3929.3 |
|
|
|
1) % of co-financing may vary per axis Source: Ministério da Agricultura, do Desenvolvimento Rural e das Pescas (2007)
B.6 Less Favoured Areas
According to CEU (2005), in 2005 Portugal has designed 3,346,000 ha as Less Favoured Area (LFA) (84% of UAA). The entire territory of the Autonomous Regions is classified as LFA.
B.7 Drivers of RDP strategy
Try to implement EU rural development priorities as an addition to the national policy.
C. Vision on the CAP beyond 2013*
C.1 Stages in the development of the CAP debate
Is there a debate about the CAP beyond 2013?
Although the debate is not yet actual, it is likely that the Ministry of Agriculture and farmers organizations will be involved in such a debate. It is expected that such a debate will start after the publication of the 'Health Check'. Now the debate is restricted to some individual academic people.
C2 Key issues in the debate
Components and role of the CAP
- CAP should contribute to the continuation of farming in rural areas, and thereby providing reasonable incomes for farmers, safeguarding land use and protecting the environment.
Organisation of the CAP (first and second pillar)
No information
Financing of the CAP
- No renationalization; No decrease of the CAP budget;
- Increase in the rate of compulsory modulation of SFP in the first pillar (Agra Europe, 2008).
* Information provided by Carel Heringa, and Jose Lima Santos
D. Literature, sources, references
- Agra Europe (2007), "Threat of SFP cuts rises as NMS accede", Agra Europe Weekly, January 12
- Agra Europe (2008), "Council split over modulation, aid capping", Agra Europe Weekly, January 25
- Council of the European Union (CEU) (2005), Proposal for a Council Regulation on support for rural development by the European Agricultural Fund for Rural Development (EAFRD) - redefinition of intermediate less-favoured areas, Brussels, Working Party on Agricultural Structures and Rural Development, working document (7971/05), 15 April
- Council of the European Union (CEU) (2006), Council Regulation 1782/2003 (consolidated version - August 5, 2006), Annex VIII and VIIIa, Brussels
- European Commission (EC) (2006), 35th Financial Report on the European Agricultural Guidance and Guarantee Fund, Guarantee section, 2005 Financial Year, SEC(2006)1152
- European Commission (EC) (2007a), EU support for rural development 2007-2013; Pre-allocated funding under Heading 2 "Natural Resources" of the Financial Framework, Brussels: European Commission
- European Commission (EC) (2007b), Overview of the implementation of direct payments under the CAP in Member States Version November2007, EC, DG for Agriculture and Rural Development
- IEEP (2005), The development and implementation of cross compliance in the EU15: an analysis. Report for the RSPB, Institute for European Environmental Policy
- Ministério da Agricultura, do Desenvolvimento Rural e das Pescas (2007), Rural Development Programme Mainland Portugal 2007-2013 (Programa de Desenvolvimento Rural Continente 2007-2013), Lisboa, version November 2007
